Die folgenden Queries verschaffen einen Überblick über das Erstellen von Diagrammen mit einfachen Zahlenwerten für X-VALUES.
Tabelle
TYPE 'table'
X-VALUES [1, 2, 3, 4, 5]
VALUES x
VALUES x*x
VALUES x+x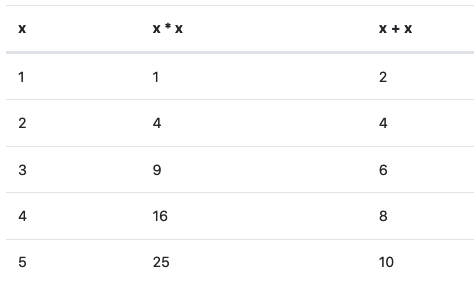
Punktdiagramm
TYPE 'scatter'
X-VALUES [1, 2, 3, 4, 5]
VALUES x
VALUES x*x
VALUES x+x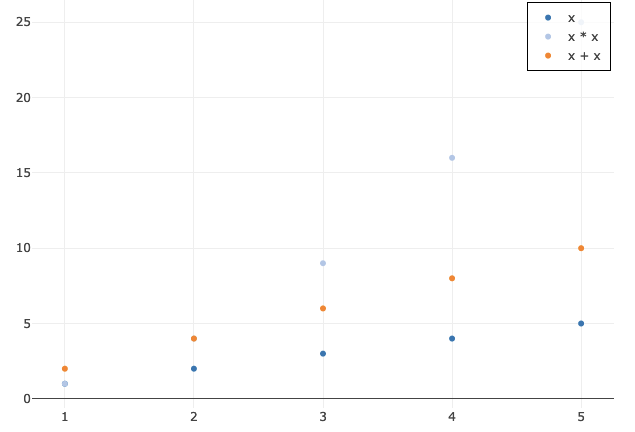
Verbundene Linien
TYPE 'line'
X-VALUES [1, 2, 3, 4, 5]
VALUES x
VALUES x*x
VALUES x+x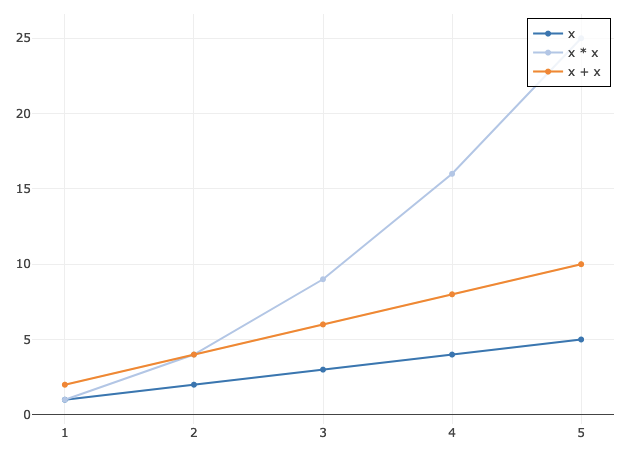
Säulendiagramm
TYPE 'bar'
X-VALUES [1, 2, 3, 4, 5]
VALUES x
VALUES x*x
VALUES x+x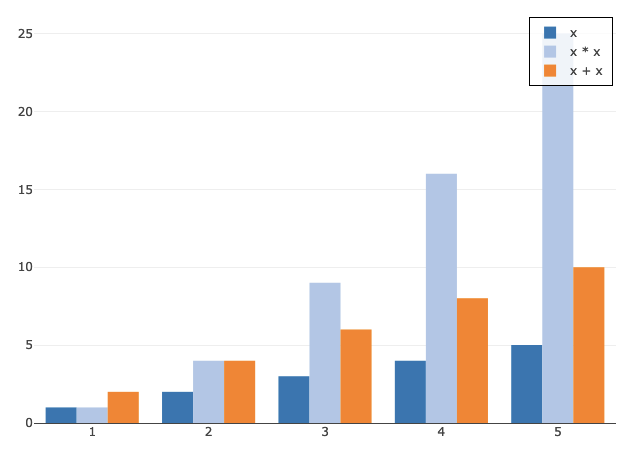
Legende nach unten verschoben
TYPE 'bar' legend='bottom'
X-VALUES [1, 2, 3, 4, 5]
VALUES x
VALUES x*x
VALUES x+x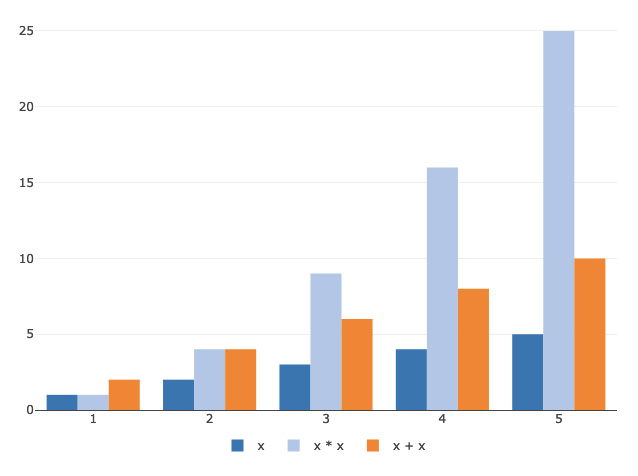
Farben geändert
TYPE 'bar' legend='bottom' colors=['yellow', 'red', 'green']
X-VALUES [1, 2, 3, 4, 5]
VALUES x
VALUES x*x
VALUES x+x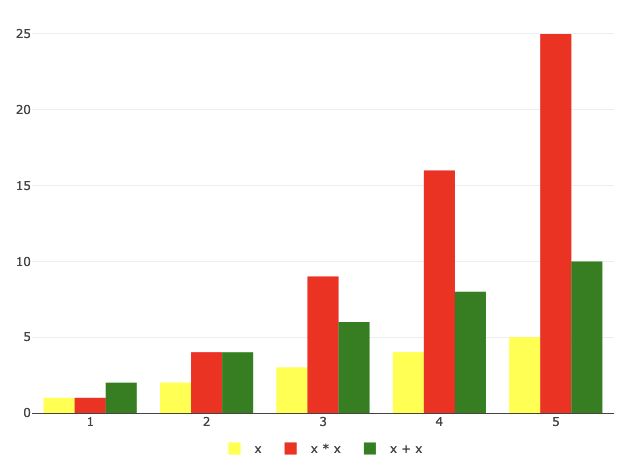
Flächen ausgefüllt
TYPE 'area' legend='bottom' colors=['yellow', 'red', 'green']
X-VALUES [1, 2, 3, 4, 5]
VALUES x
VALUES x*x
VALUES x+x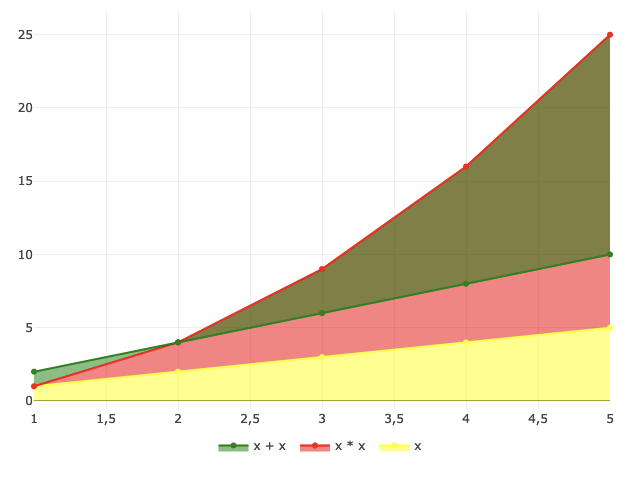
Grafik gedreht
TYPE 'area' rotated=y legend='bottom' colors=['yellow', 'red', 'green']
X-VALUES [1, 2, 3, 4, 5]
VALUES x
VALUES x*x
VALUES x+x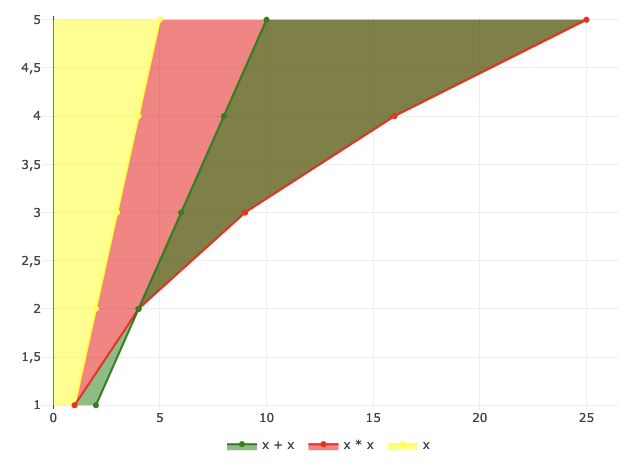
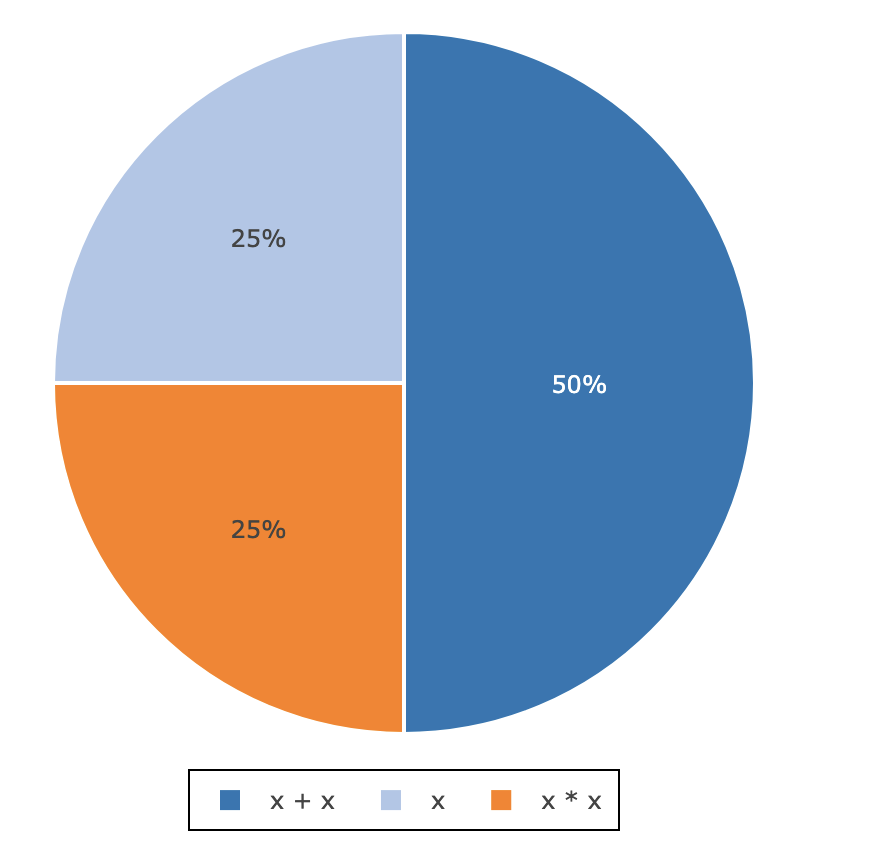
Kreisdiagramm
TYPE 'pie' legend='bottom'
X-VALUES [1, 2, 3, 4, 5]
VALUES x
VALUES x*x
VALUES x+x